If you have read updates from La Trobe Financial over many years, you will have heard us provide, again and again, very simple wealth creation measures: Patience, Simplicity & Diversification. We preached these messages because again and again, at all levels, these simple tenets of creating wealth work. While we have tended to focus on the micro, let’s look at the bigger picture and the opportunity which exists for those who can get it right.
Australia: The Lucky Country
Australia as the lucky country was not originally meant as a compliment. It held that an abundance of natural resources provided our opportunities for success, with our successes being a case of good luck not good management. And while there is no doubt we have benefitted from mining and agriculture, these are often given disproportionate weight to the discussions around our economic fortunes:
Australia, as a country, continues to punch above its weight globally. With cost of living pressures rising from the recent bout of inflation , it can be easy to overlook that we are among the wealthiest people in the world. Consider median wealth. This is the amount of wealth held by the person in the middle of Australia’s wealth distribution: i.e., there are the same number of people with more wealth, as there are with less wealth. Median wealth is a useful measure as it is measuring at the mid-point, whereas average wealth numbers can be distorted by a few individuals who hold a disproportionate amount of wealth.
That mid-point person in Australia has wealth of US$261,805. And that’s a lot. It is the second highest median net wealth position of any country globally.
| Top 25 in Median Wealth | ||
| 1st | Luxembourg | 372,258 |
| 2nd | Australia | 261,805 |
| 3rd | Belgium | 256,185 |
| 4th | Hong Kong SAR | 206,859 |
| 5th | New Zealand | 202,525 |
| 6th | Denmark | 193,669 |
| 7th | Switzerland | 171,035 |
| 8th | United Kingdom | 163,515 |
| 9th | Norway | 152,233 |
| 10th | Canada | 142,587 |
| 11th | France | 140,593 |
| 12th | Netherlands | 116,948 |
| 13th | Italy | 113,754 |
| 14th | United States | 112,157 |
| 15th | Spain | 111,270 |
| 16th | Taiwan | 110,521 |
| 17th | Japan | 106,999 |
| 18th | Singapore | 104,959 |
| 19th | Malta | 102,451 |
| 20th | Korea | 95,872 |
| 21st | Ireland | 95,459 |
| 22nd | Qatar | 92,789 |
| 23rd | Finland | 87,878 |
| 24th | Sweden | 82,864 |
| 25th | Slovenia | 81,195 |
Source:UBS Global Wealth Report 2024
What’s more, Australia’s is a diverse economy with a range of opportunities for its population. Ours is among the more ‘equal’ populations for wealth distribution. In the past 15 years, our levels of inequality of wealth have remained somewhat steady, a result we fare far better than most other advanced economies around the world.
| Wealth Inequality | Change | ||
| 2008 | 2023 | 2008-2023 | |
| South Africa | 70 | 82 | 17.7% |
| Brazil | 70 | 81 | 16.8% |
| United Arab Emirates | 88 | 77 | -12.4% |
| Saudi Arabia | 89 | 77 | -13.3% |
| Sweden | 74 | 75 | 1.3% |
| United States | 76 | 75 | -2.4% |
| India | 62 | 73 | 16.2% |
| Mexico | 68 | 72 | 6.5% |
| Singapore | 57 | 70 | 22.9% |
| Indonesia | 59 | 68 | 15.1% |
| Germany | 72 | 68 | -5.4% |
| Switzerland | 70 | 67 | -4.6% |
| Austria | 69 | 65 | -5.0% |
| Netherlands | 67 | 64 | -3.6% |
| Finland | 53 | 64 | 21.0% |
| Israel | 72 | 64 | -12.2% |
| Hong Kong SAR | 66 | 63 | -5.9% |
| Denmark | 56 | 62 | 11.3% |
| United Kingdom | 57 | 61 | 7.5% |
| Taiwan | 55 | 61 | 10.5% |
| Mainland China | 55 | 60 | 7.4% |
| France | 56 | 59 | 4.7% |
| Italy | 50 | 57 | 14.9% |
| Korea | 62 | 57 | -8.1% |
| Spain | 47 | 57 | 19.8% |
| Japan | 50 | 54 | 9.4% |
| Australia | 51 | 54 | 5.4% |
| Qatar | 43 | 48 | 12.5% |
| Belgium | 51 | 46 | -10.7% |
Source:UBS Global Wealth Report 2024
Another important, but difficult to measure attribute is ‘Wealth Mobility’. This is not moving from one city to another chasing work. This is where an individual’s overall wealth increases – or decreases – from one wealth bracket to another. Here in Australia, again we do well.
It begins with income. Australians born between 1976 and 1982 have a 67% likelihood of earning comparatively more than their parents did at a similar age. And this is particularly the case from lower income families. So structurally, Australia is providing opportunities where kids are earning incomes greater than their parents at the same time in their careers.
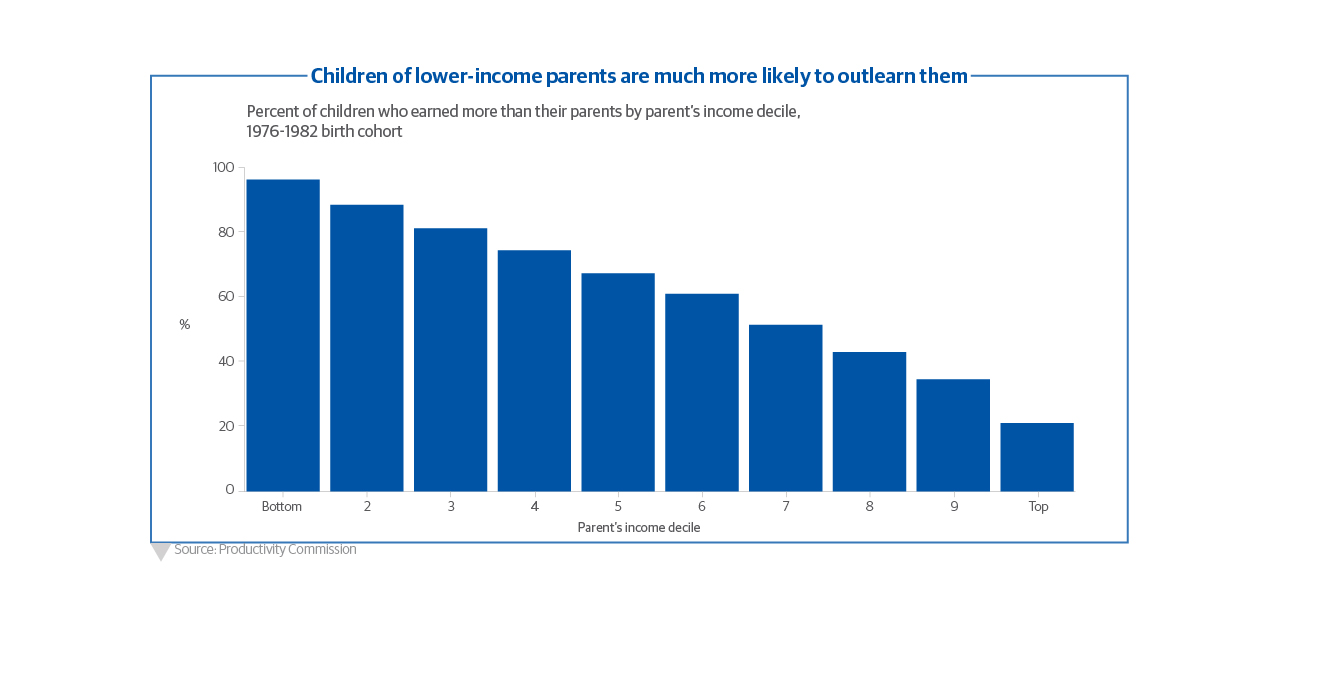
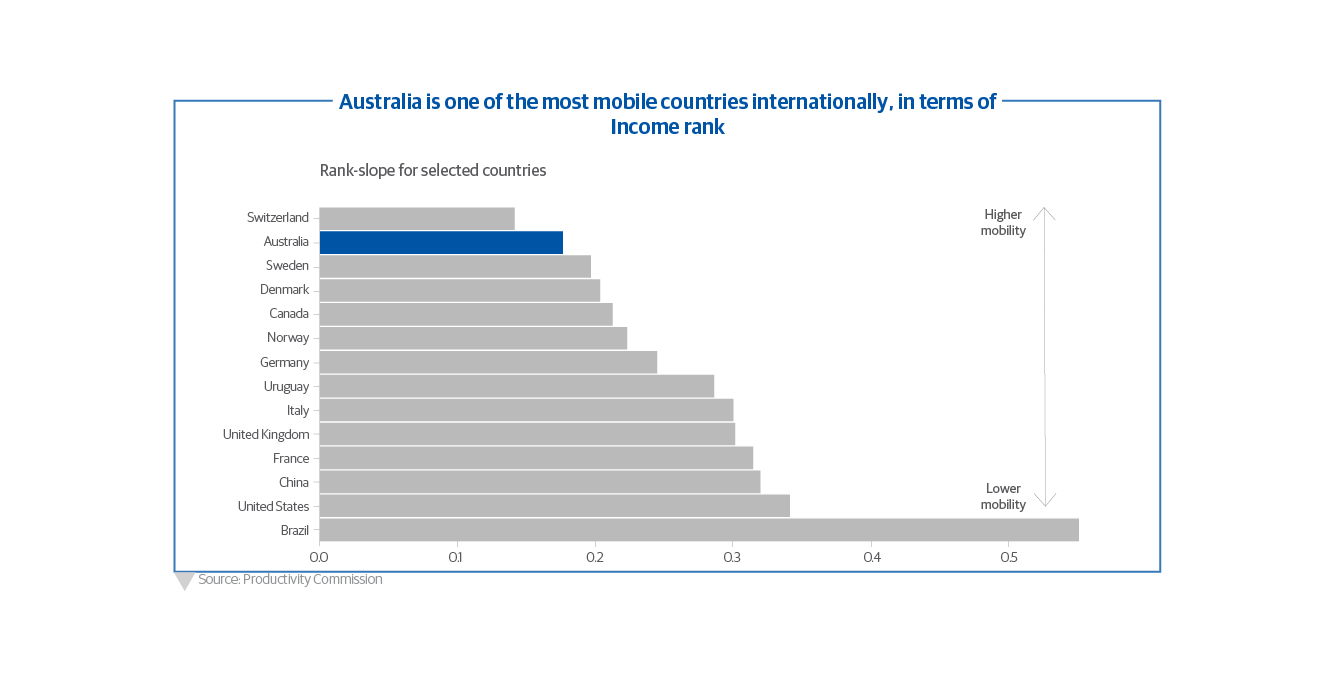
Against this backdrop, Australia provides outstanding opportunity for income and wealth mobility. For example, only 16% of children with parents from the bottom income decile, themselves remain in the bottom decile. The other 84% step into higher income brackets. On that note, the below figures show that globally, incomes in Australia are the second-least-likely to be impacted by parental income. Only in Switzerland is someone’s income less likely to be impacted by that of their parents – pointing to higher income mobility. Lower mobility can lead to persistent poverty, and entrenched disadvantage across generations.
The Future Looks Bright…
Wealth might begin with income, but it is turbocharged with intergenerational wealth transfers. And an intergenerational wealth transfer is underway, with some $3.4 trillion of assets set to transfer from the Silent Generation and Boomers to Millennials.
While it’s not to say we are free of poverty or economic distress, comparatively speaking, Australians are well placed for a bright future. On a global scale, we have high median wealth. We are presented with opportunities for advancement. In fact, off such a solid economic foundation, it’s forecast that Millennials will become the richest generation in history.
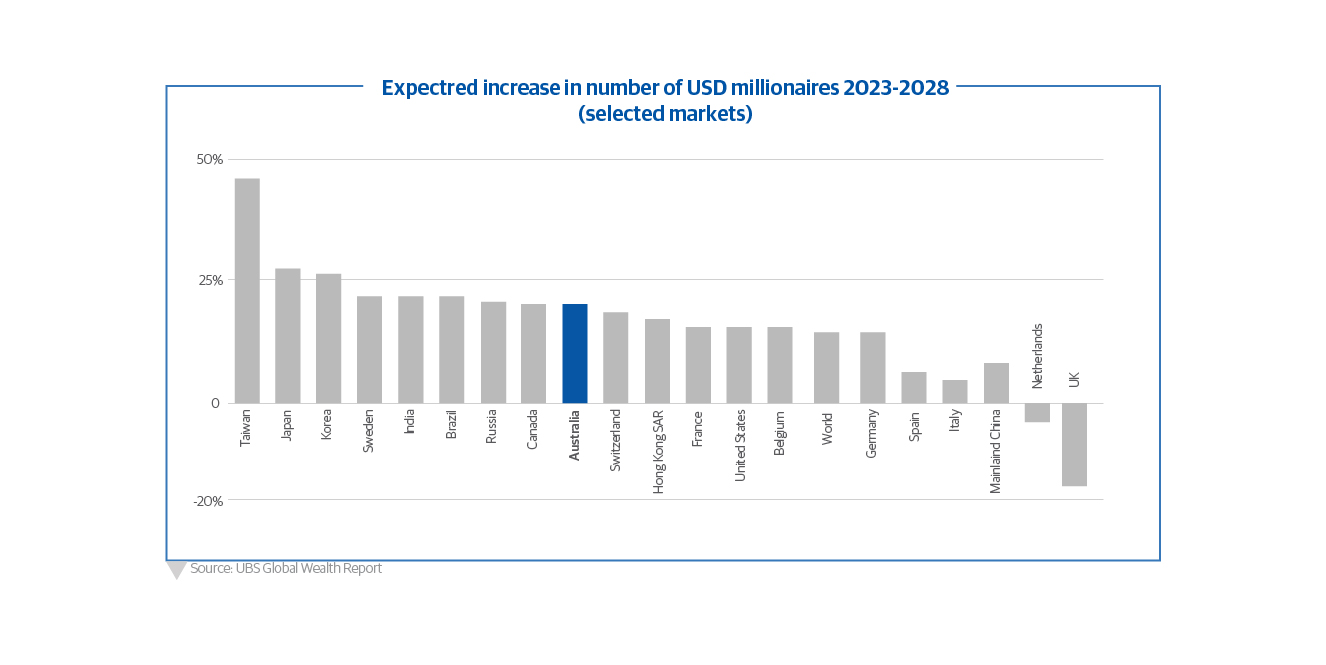
Indeed, the number of millionaires here in Australia, is set to grow by some 20% in the next five years alone. In numbers, we concluded 2023 with 1,936,114 millionaires. By 2028, this number is forecast to increase to 2,334,015. That’s nearly 400,000 new millionaires in a very short timeframe.
Invest in Portfolios with Generational Performance
Let’s now turn back to those initial tenets of investment. Consider the impacts on managing this money without being Patient. Without keeping things Simple. Without consideration to Diversification. Large portfolios can become, well, a lot smaller. And fast.
Investors with La Trobe Financial have shared many milestones across our long journey: continued strength in performance, various industry awards, and consistently being among the fastest growing funds in Australia. More recently, we passed $20 billion in total assets under management as we confirmed our position as Australia’s premier alternative asset manager.
In a market of greater complexity, investors are increasingly looking for quality investment products that are intuitive, easy to understand, and add real value to portfolios. And in a market where making the right decision matters more than ever, our range of products provide a variety of return and duration profiles that suit a whole range of investor requirements.
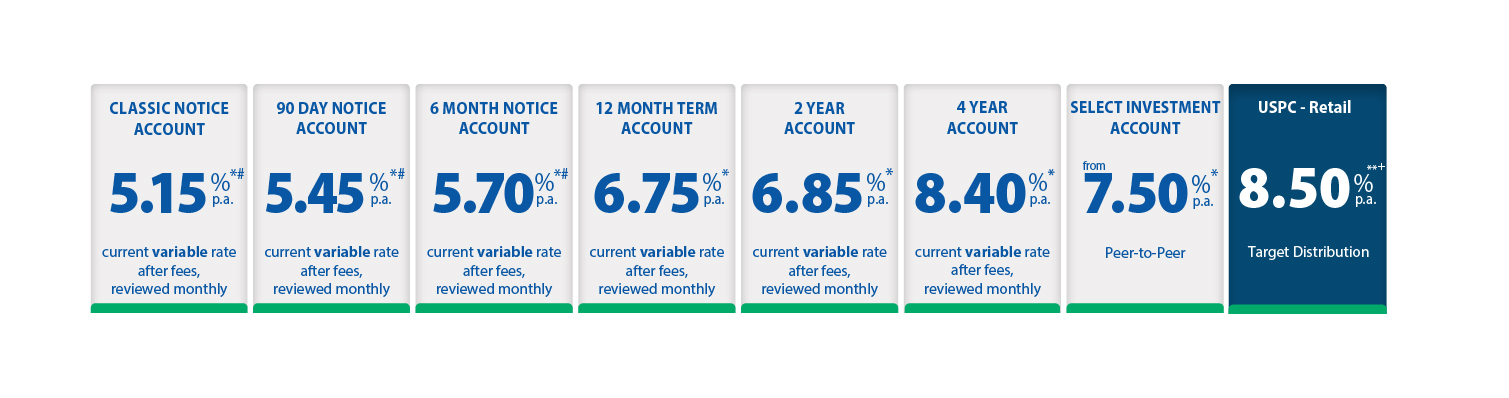
Contact La Trobe Financial today to speak with our Asset Management Team about our Australian Real Estate Private Credit products, with over 35 years history in market. Or, learn about our recently-launched La Trobe Global Asset Management strategy; spearheaded by the La Trobe US Private Credit Fund.
These investments provide low-volatility income for people with generational investment in mind. And we deliver them with our commitment to service and looking out for you.
*The variable rates of return are current at 1 April 2024. The rates of return are reviewed and determined monthly, are not guaranteed, and may be lower than expected. The rates of return are determined by the future revenue of the Credit Fund, and distributions for any given month are paid within 14 days after month end.
An investment in the Credit Fund is not a bank deposit, and investors risk losing some or all of their principal investment. Past performance is not a reliable indicator of future performance. Withdrawal rights are subject to liquidity and may be delayed or suspended.
#We will make every endeavour to release your funds after receiving your withdrawal request: within 2 business days for the Classic Notice Account, 90 days for the 90 Day Notice Account, and 180 days for the 6 Month Notice Account. However, we have 12-months under the Fund’s Constitution to fulfill the request. When determining whether to honour your withdrawal request within the specified timeframes we have to have regard to the Fund’s ability to realise for value the relevant assets and the best interests of investors. While there is a risk of not honouring your withdrawal request within 2 business days, 90 days or 180 days, it’s important to note that there has never been a case in the history of the Fund when we have not honoured a withdrawal request on time due to a lack of liquidity.
** The target distribution return is net of fees and costs but excludes any adjustments for FX rate fluctuations. The target return is reviewed monthly and may change. This target return is determined with reference to the return benchmark of the Secured Overnight Financing Rate (SOFR) + 3% as at 30 May 2024. This is a target return only and may not be achieved.
+Redemption requests are generally processed on a quarterly basis in accordance with this PDS. Investors do not have a right to redeem and the Responsible Entity (RE) may reject redemption requests. The ability to redeem is subject to liquidity and the processing of redemptions may be delayed or suspended in certain circumstances. The RE will limit redemptions to up to 5% of the issued Class B Units each quarter. Redemption requests exceeding that limit may be accepted by the RE, pro-rated or scaled back to 5%. Please refer to this PDS for more details about redeeming Class B Units and how to submit a redemption request form.
La Trobe Financial Asset Management Limited ACN 007 332 363 Australian Financial Services Licence No. 222213 is the responsible entity of the La Trobe Australian Credit Fund ARSN 088 178 321 and the La Trobe US Private Credit Fund ARSN 677 174 382. It is important that you consider the relevant Product Disclosure Statement (PDS) before deciding whether to invest or continue to invest in the fund. The PDSs and Target Market Determinations are available on our website.
Past Performance is not a reliable indicator of future performance.
Any financial product advice is general only and has been prepared without considering your objectives, financial situation or needs. You should, before investing or continuing to invest in the La Trobe Australian Credit Fund & La Trobe US Private Credit Fund, consider the appropriateness of the advice having regard to your objectives, financial situation or needs and obtain and consider the relevant Product Disclosure Statement for the fund.